2024 · DevOps / Observability · Web
PulseDash
Next.js · WebSockets · Tailwind CSS · SaaS
The Challenge
Overwhelmed by unnecessary features and steep learning curves.
- —Legacy observability tools like Grafana require immense configuration overhead.
- —Cluttered UIs with hundreds of features obscure critical health metrics.
- —Difficult to find actionable data quickly during a live system incident.
The Solution
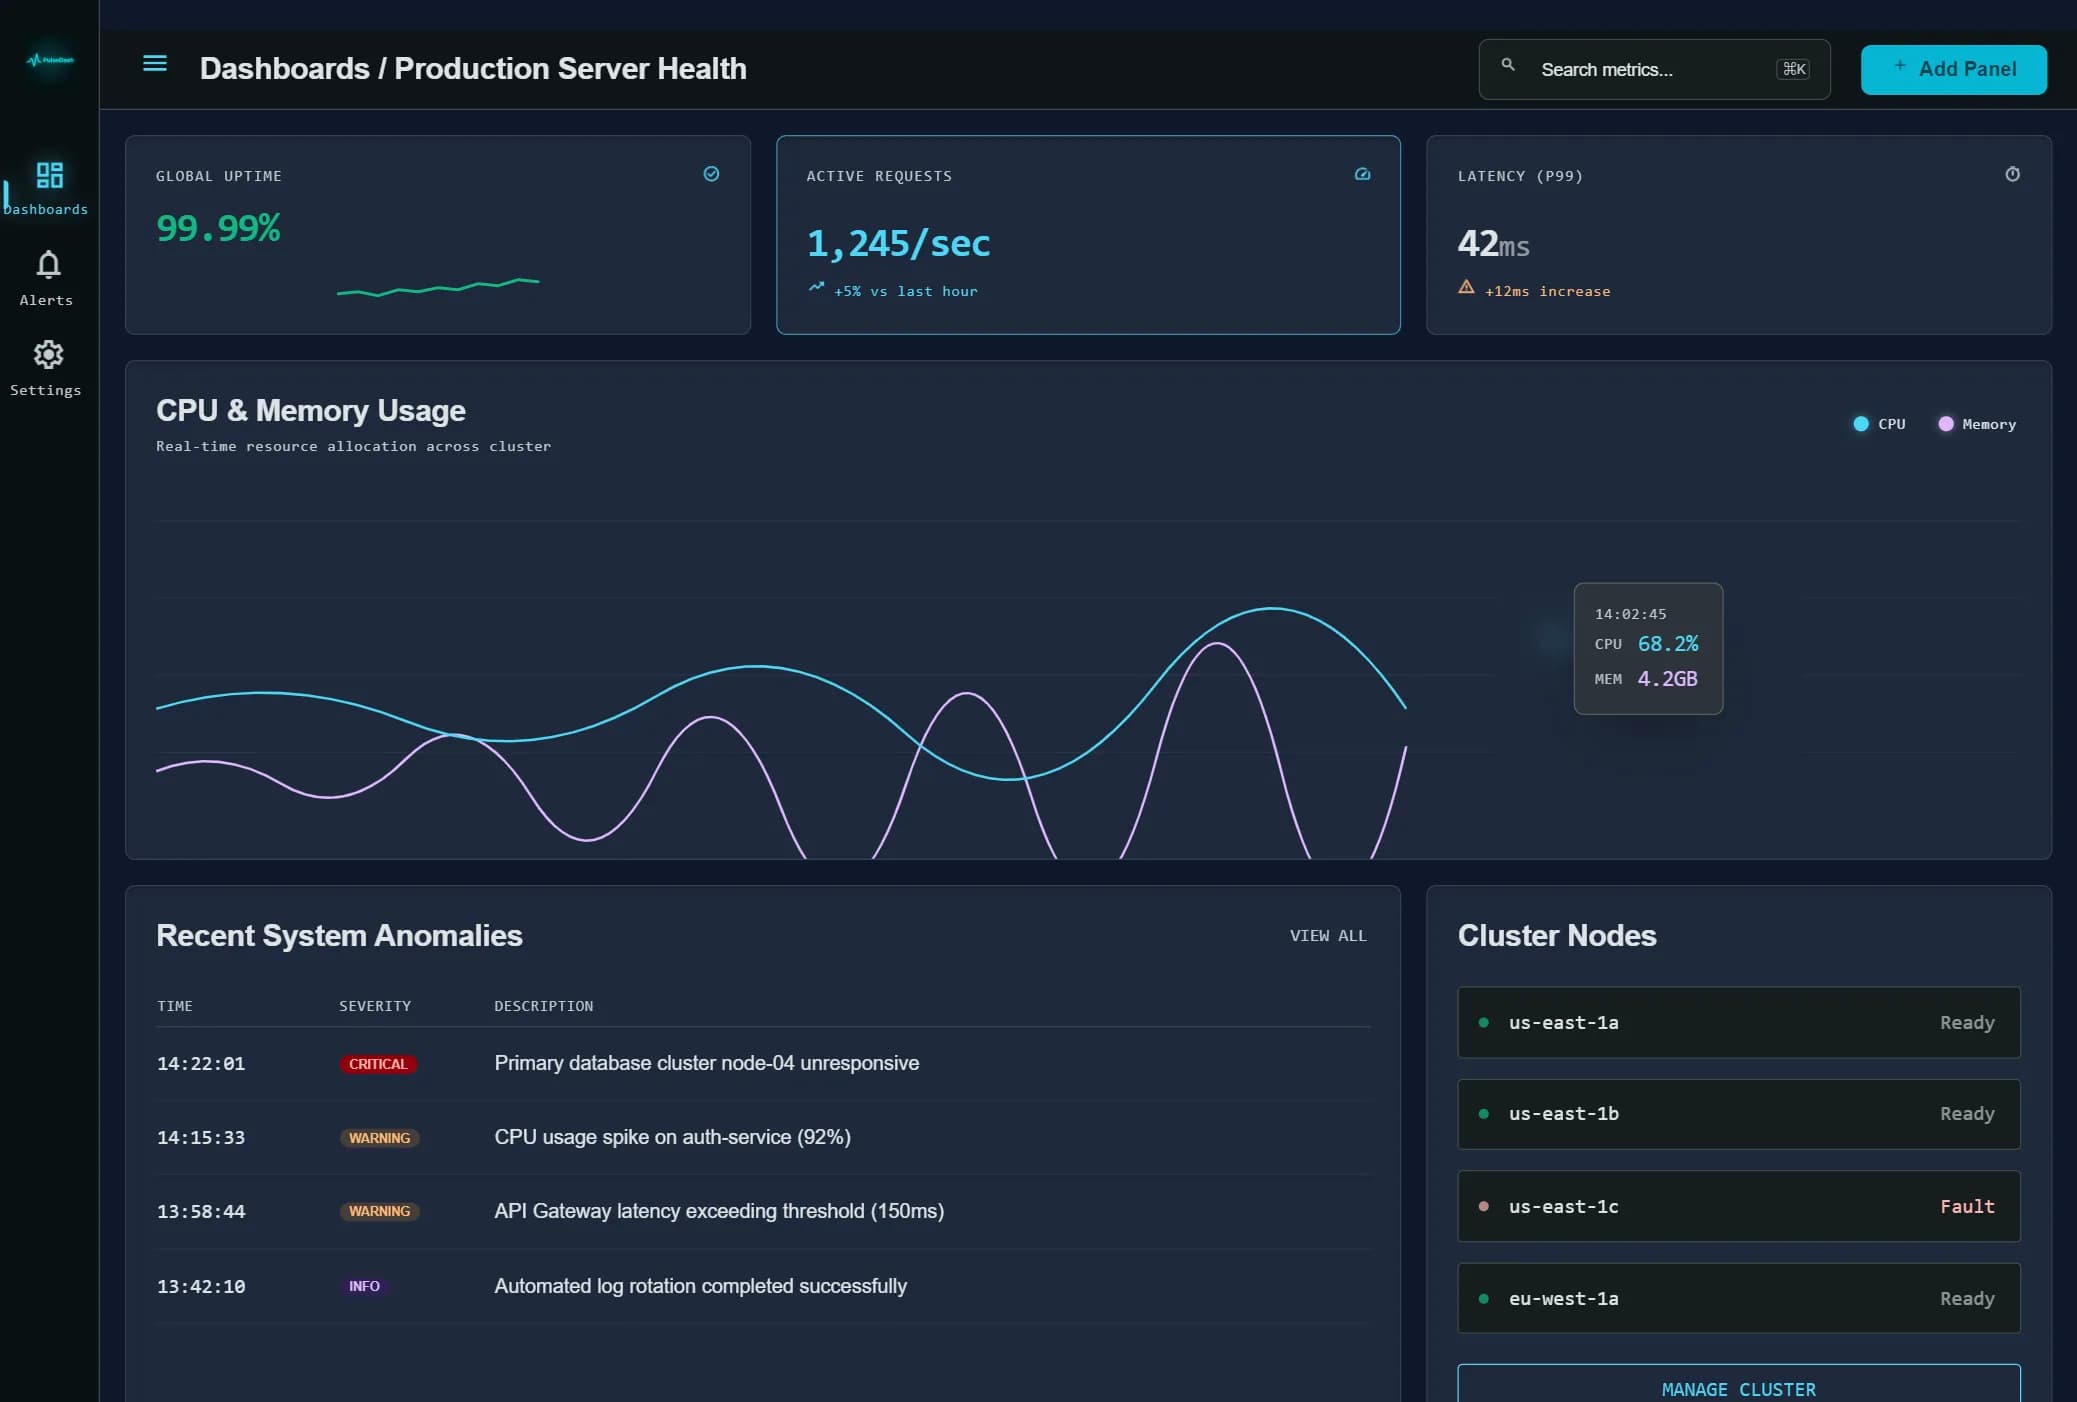
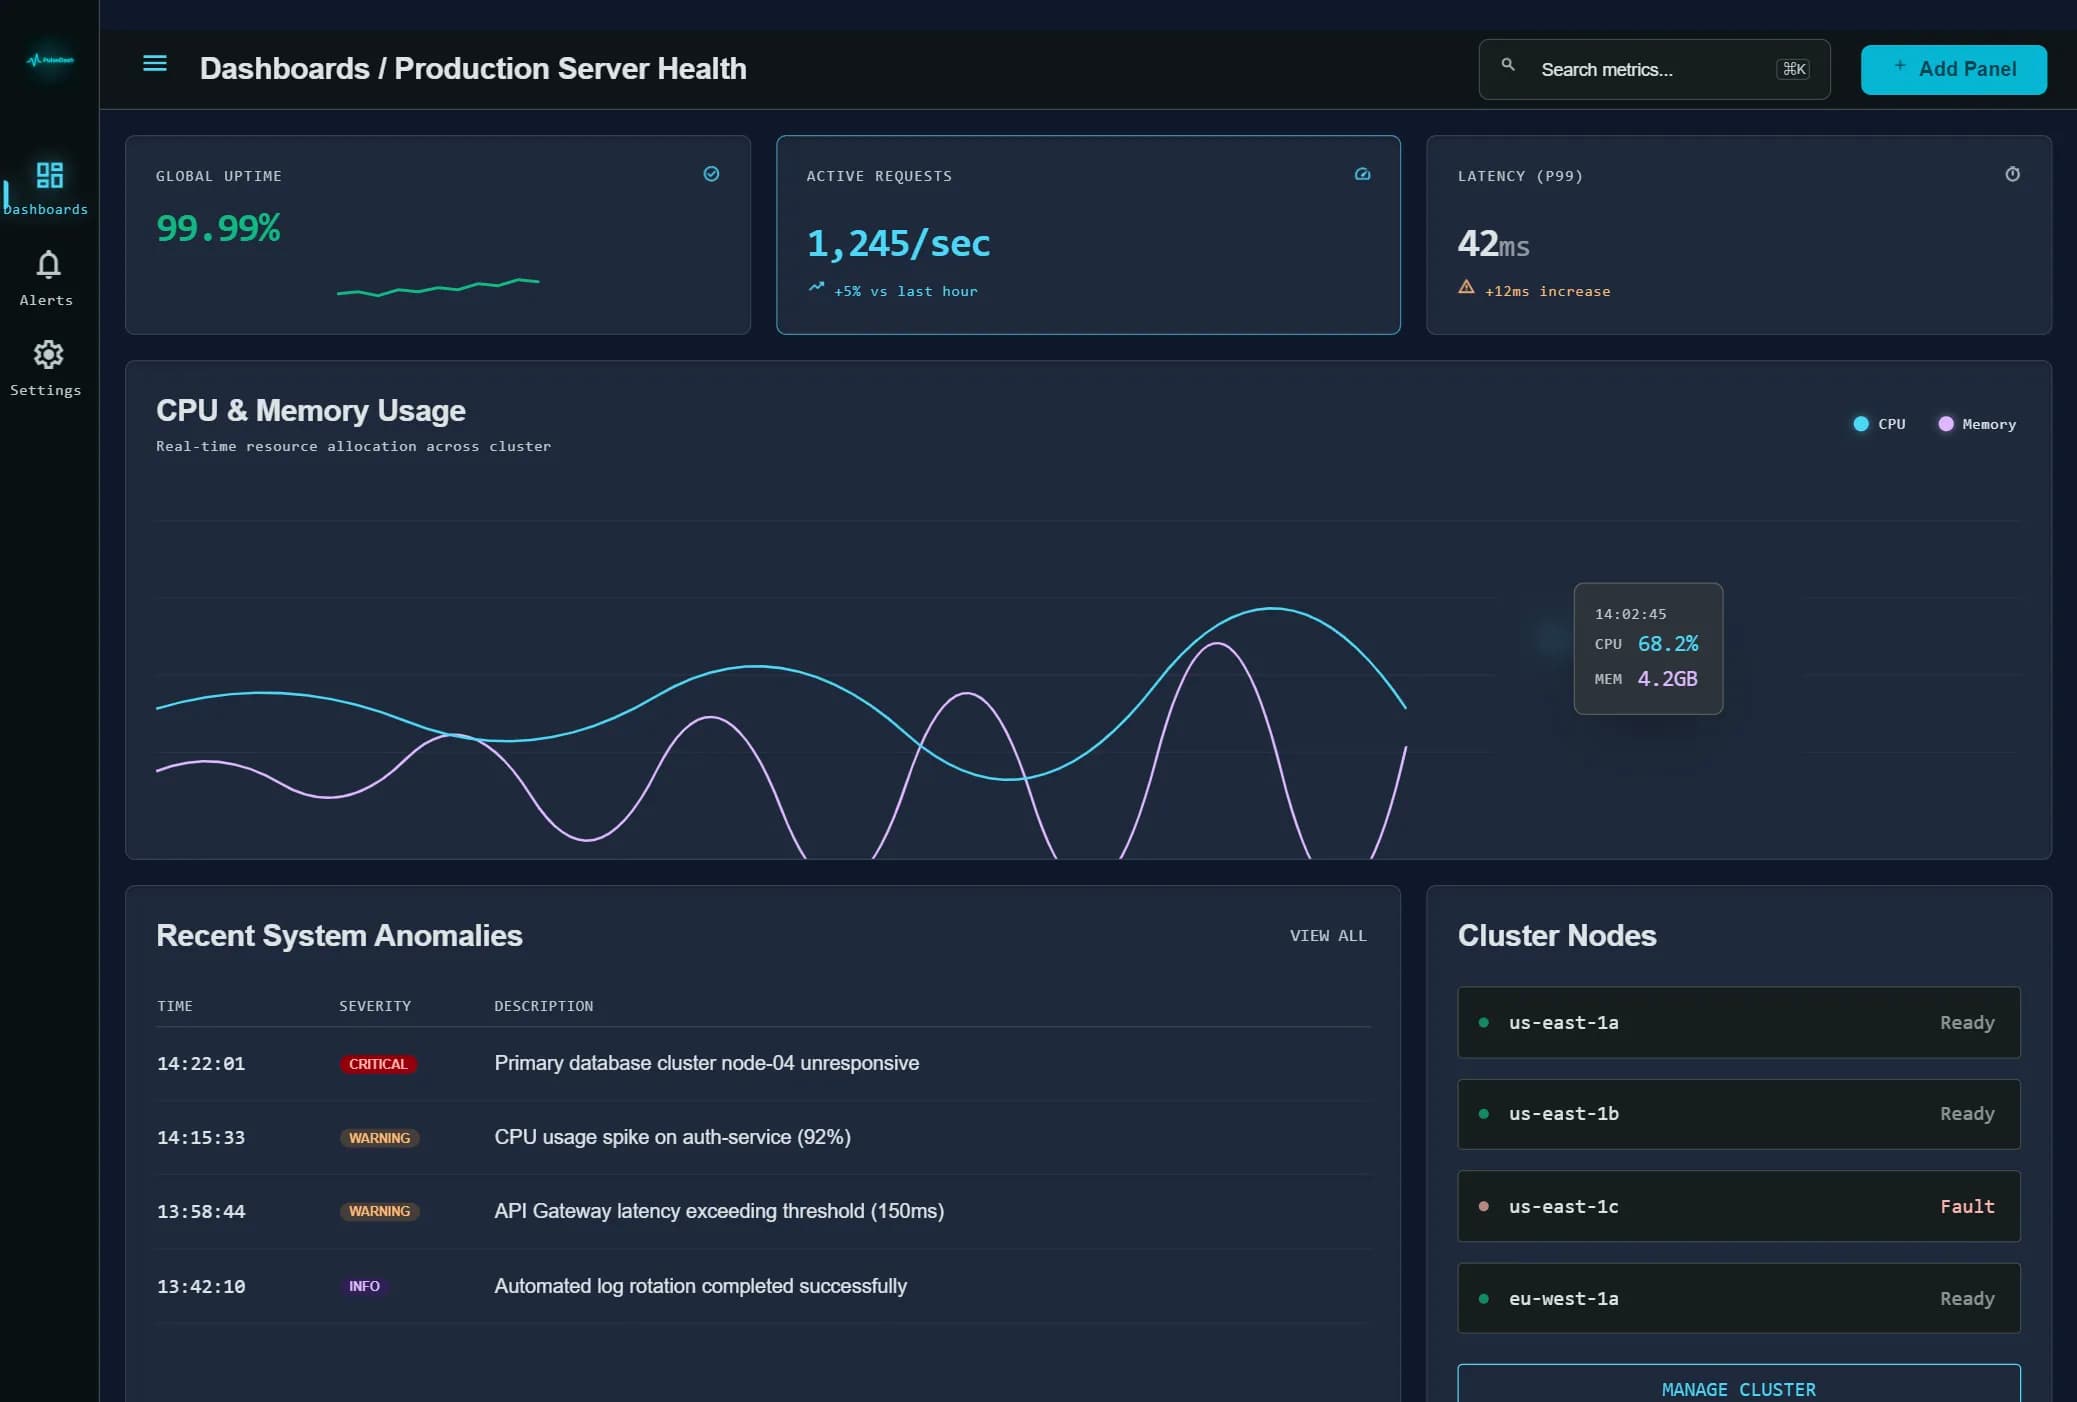
A beautifully simplified, distraction-free observability dashboard.
- —Prioritized a highly legible interface focusing exclusively on critical metrics.
- —Monitors uptime, active requests, and recent anomalies at an absolute glance.
- —Zero-configuration setup leads to immediate adoption across engineering teams.
HOW IT WORKS
Go Microservice
Memory-safe ingestion pipeline effortlessly filters over 100k raw events per second.
Apache Kafka Streaming
Distributed streaming platform acts as the central nervous system of the architecture.
Full-Duplex WebSockets
Node.js edge servers push aggregated JSON payloads to clients at sub-50ms intervals.
Hardware-Accelerated Canvas
D3.js and Canvas API eliminate browser memory leaks typical of legacy dashboards.
Optimized React Hooks
Strictly prevents unnecessary DOM reflows during high-frequency data mutations.
Static Next.js Frontend
Lightning-fast delivery with premium deep dark mode and neon alert accents.
SCREENSHOTS
MEASURABLE RESULTS
-60%
Time to Identify
Faster incident response
Minimal
UI Complexity
Distraction-free grid
<50ms
Real-time Latency
WebSocket integration